

Common modifiable risk factors in total joint arthroplasty: a 2021 update—obesity
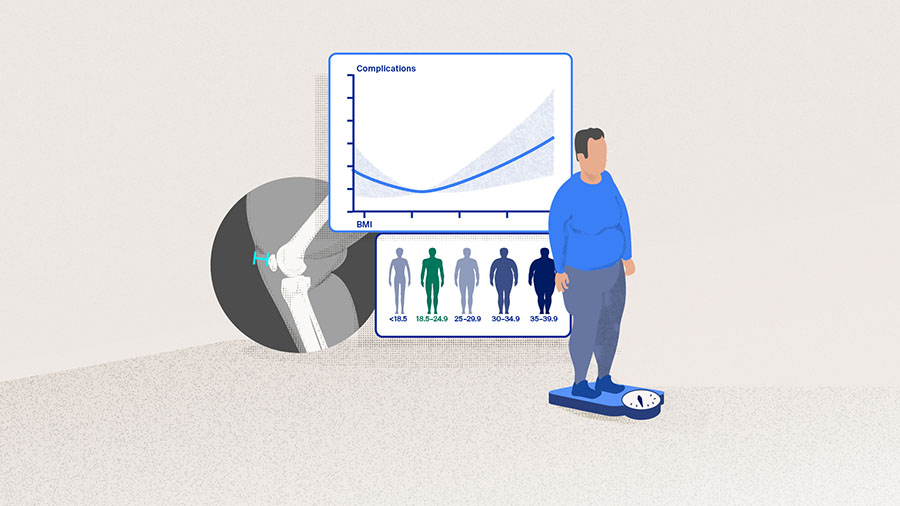
In a 2019 clinical practice guideline published by the American Academy of Orthopaedic Surgeons, it was stated that, among all risk factors evaluated, only obesity could be deemed as having reached the level of moderate strength evidence as a risk factor for periprosthetic joint infection (PJI) [1]. In the guideline, all three moderate-quality studies used body mass index (BMI) as a global measure of obesity, and all three determined that a statistically significant increase in adverse outcomes was associated with a BMI greater than 35 kg/m2. Is BMI the best indicator of obesity and surgical difficulty? Are there other ways to determine if an obese patient is suitable for an arthroplasty? What does the proper management of obese patients look like? Michael A Mont, MD, Orthopaedic Surgeon, Rubin Institute for Advanced Orthopedics, introduces the evidence on this topic and shares his experience with us.

Michael A Mont
Rubin Institute for Advanced Orthopedics
Baltimore, United States
High BMI: a cause for delaying or denying obese patients of arthroplasty?
As patients who have BMIs ≥ 40–50 kg/m2 (ie, morbidly obese and super obese patients) are increasingly among the arthroplasty patients, more evidence is now available that these patients are at risk for increased complications and worse outcomes [2–6]. Various reasons have been theorized for the cause for unfavorable outcomes in obese patients, and these include underdosing of preoperative antibiotics, thicker subcutaneous adipose tissue at the surgical site (leading to poor perfusion and lower oxygen tension in tissues, technical difficulties during surgery, as well as longer surgical times), and more frequent nasal Staphyloccocus aureus colonization [2, 7].
The exact BMI cutoff that marks a significant rise of worse outcome after TJA is still controversial [2, 8, 9]. While the balance of benefits and risks in delaying or denying patients with BMIs is still being debated, institutional (or individual) restrictions have already been applied to some obese patients in their access to TJA. In fact, other weight risk factors, such as patients who have BMI lower than 18 kg/m2 may sometimes be at a greater risk of negative outcomes due to malnutrition and low albumin [7, 10–12].
Evolving BMI thresholds of increased adverse outcomes after total joint arthroplasty
Before 2011, comparisons of BMI above and below 30 kg/m2 were frequently made in studying these relationships and the occurrence of infection after TJA [13–15]. Since then, much effort has been made in finding a BMI value that can serve as a clear threshold above which a significant increase of negative outcomes, whether it be PJI, readmission, reoperation, or a long list of other complications, can be expected. A few examples from recent publications are given below:
- For the purpose of prophylactic antibiotic dosing for patients undergoing TJA, Lübbeke et al [2] conducted a study in a prospective, hospital-based cohort (9,061 patients) of primary TJA patients to investigate the influence of obesity on the incidence of PJI. Dividing the patients into five BMI categories according to the World Health Organization (WHO) definition, the adjusted incidence rate ratio (IRR) of PJI was calculated using patients who had normal BMI as the reference for the four other BMI categories. As can be seen in Table 1 below, while the IRR of PJI in the overweight and Class I obese patients remained similar to the patients who had normal BMI, it was clearly higher in Class II and III obese patients.
Lübekke et al [2] concluded that after primary TJA, patients who had a BMI of ≥ 35 had more than double the rate of PJI than patients who had a BMI < 35.
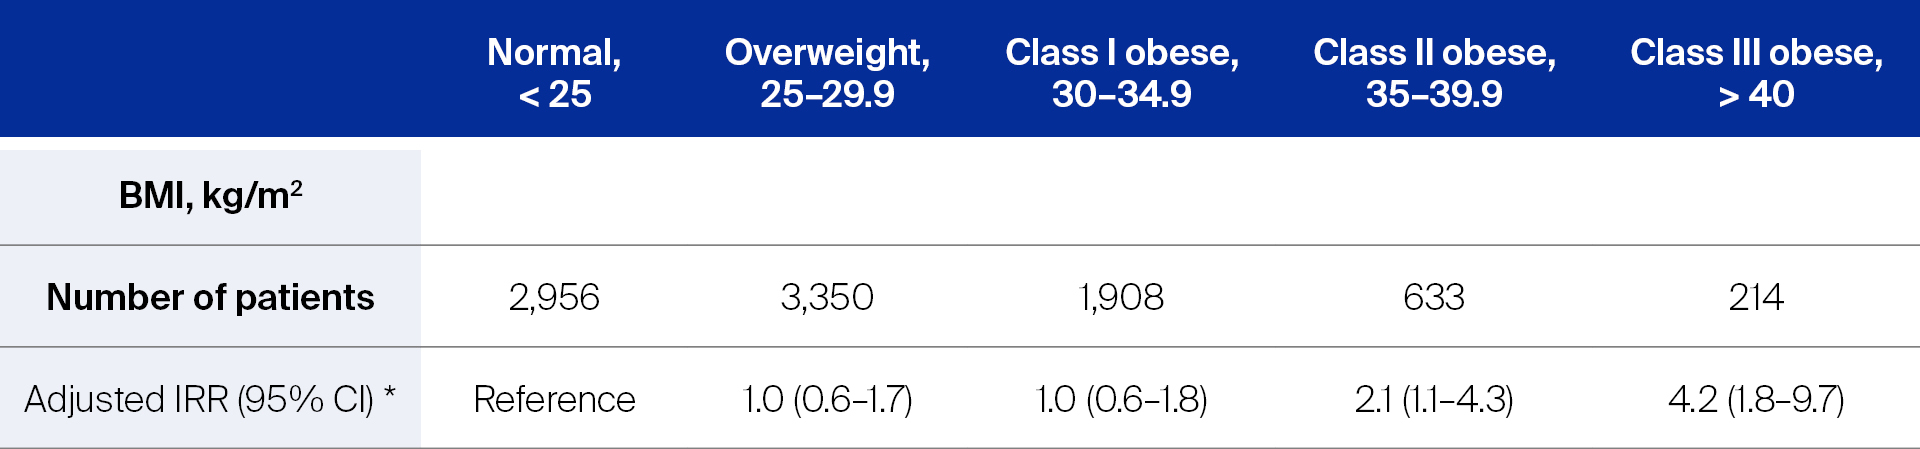
Abbreviations: BMI, body mass index; IRR, incidence rate ratio; CI, confidence interval.
* Cox regression analyses performed with adjustments for covariates such as age, sex, smoking status, diabetes, and use of antibiotic-laden cement.
- Instead of treating BMI as a dichotomous or a categorical variable, Wagner et al [4] investigated implant survival and the risk of several common complications after primary TKA (22,289 knees) using a single-center joint registry (prospectively collected demographics and outcomes). By analyzing the outcomes using BMI as a continuous variable according to a smoothing spline model, the authors described an increase in hazard ratio (HR) in reoperation, revision, and deep infection associated with each increasing unit of BMI. For example, for each unit of BMI above 30 kg/m2, there was a 5% increased risk of implant revision or removal (HR, 1.05; P < .001). Using multivariate analyses (adjusted for age, sex, surgical indication, and surgical time period), Wagner et al [4] also showed that statistically significant HR was mostly observed in patients who had a BMI over 35 or 40 (Table 2).
The authors concluded that a BMI over 35 kg/m2 was associated with increased deep infection, while a BMI over 35–40 kg/m2 was associated with a higher rate of implant revision and aseptic loosening.
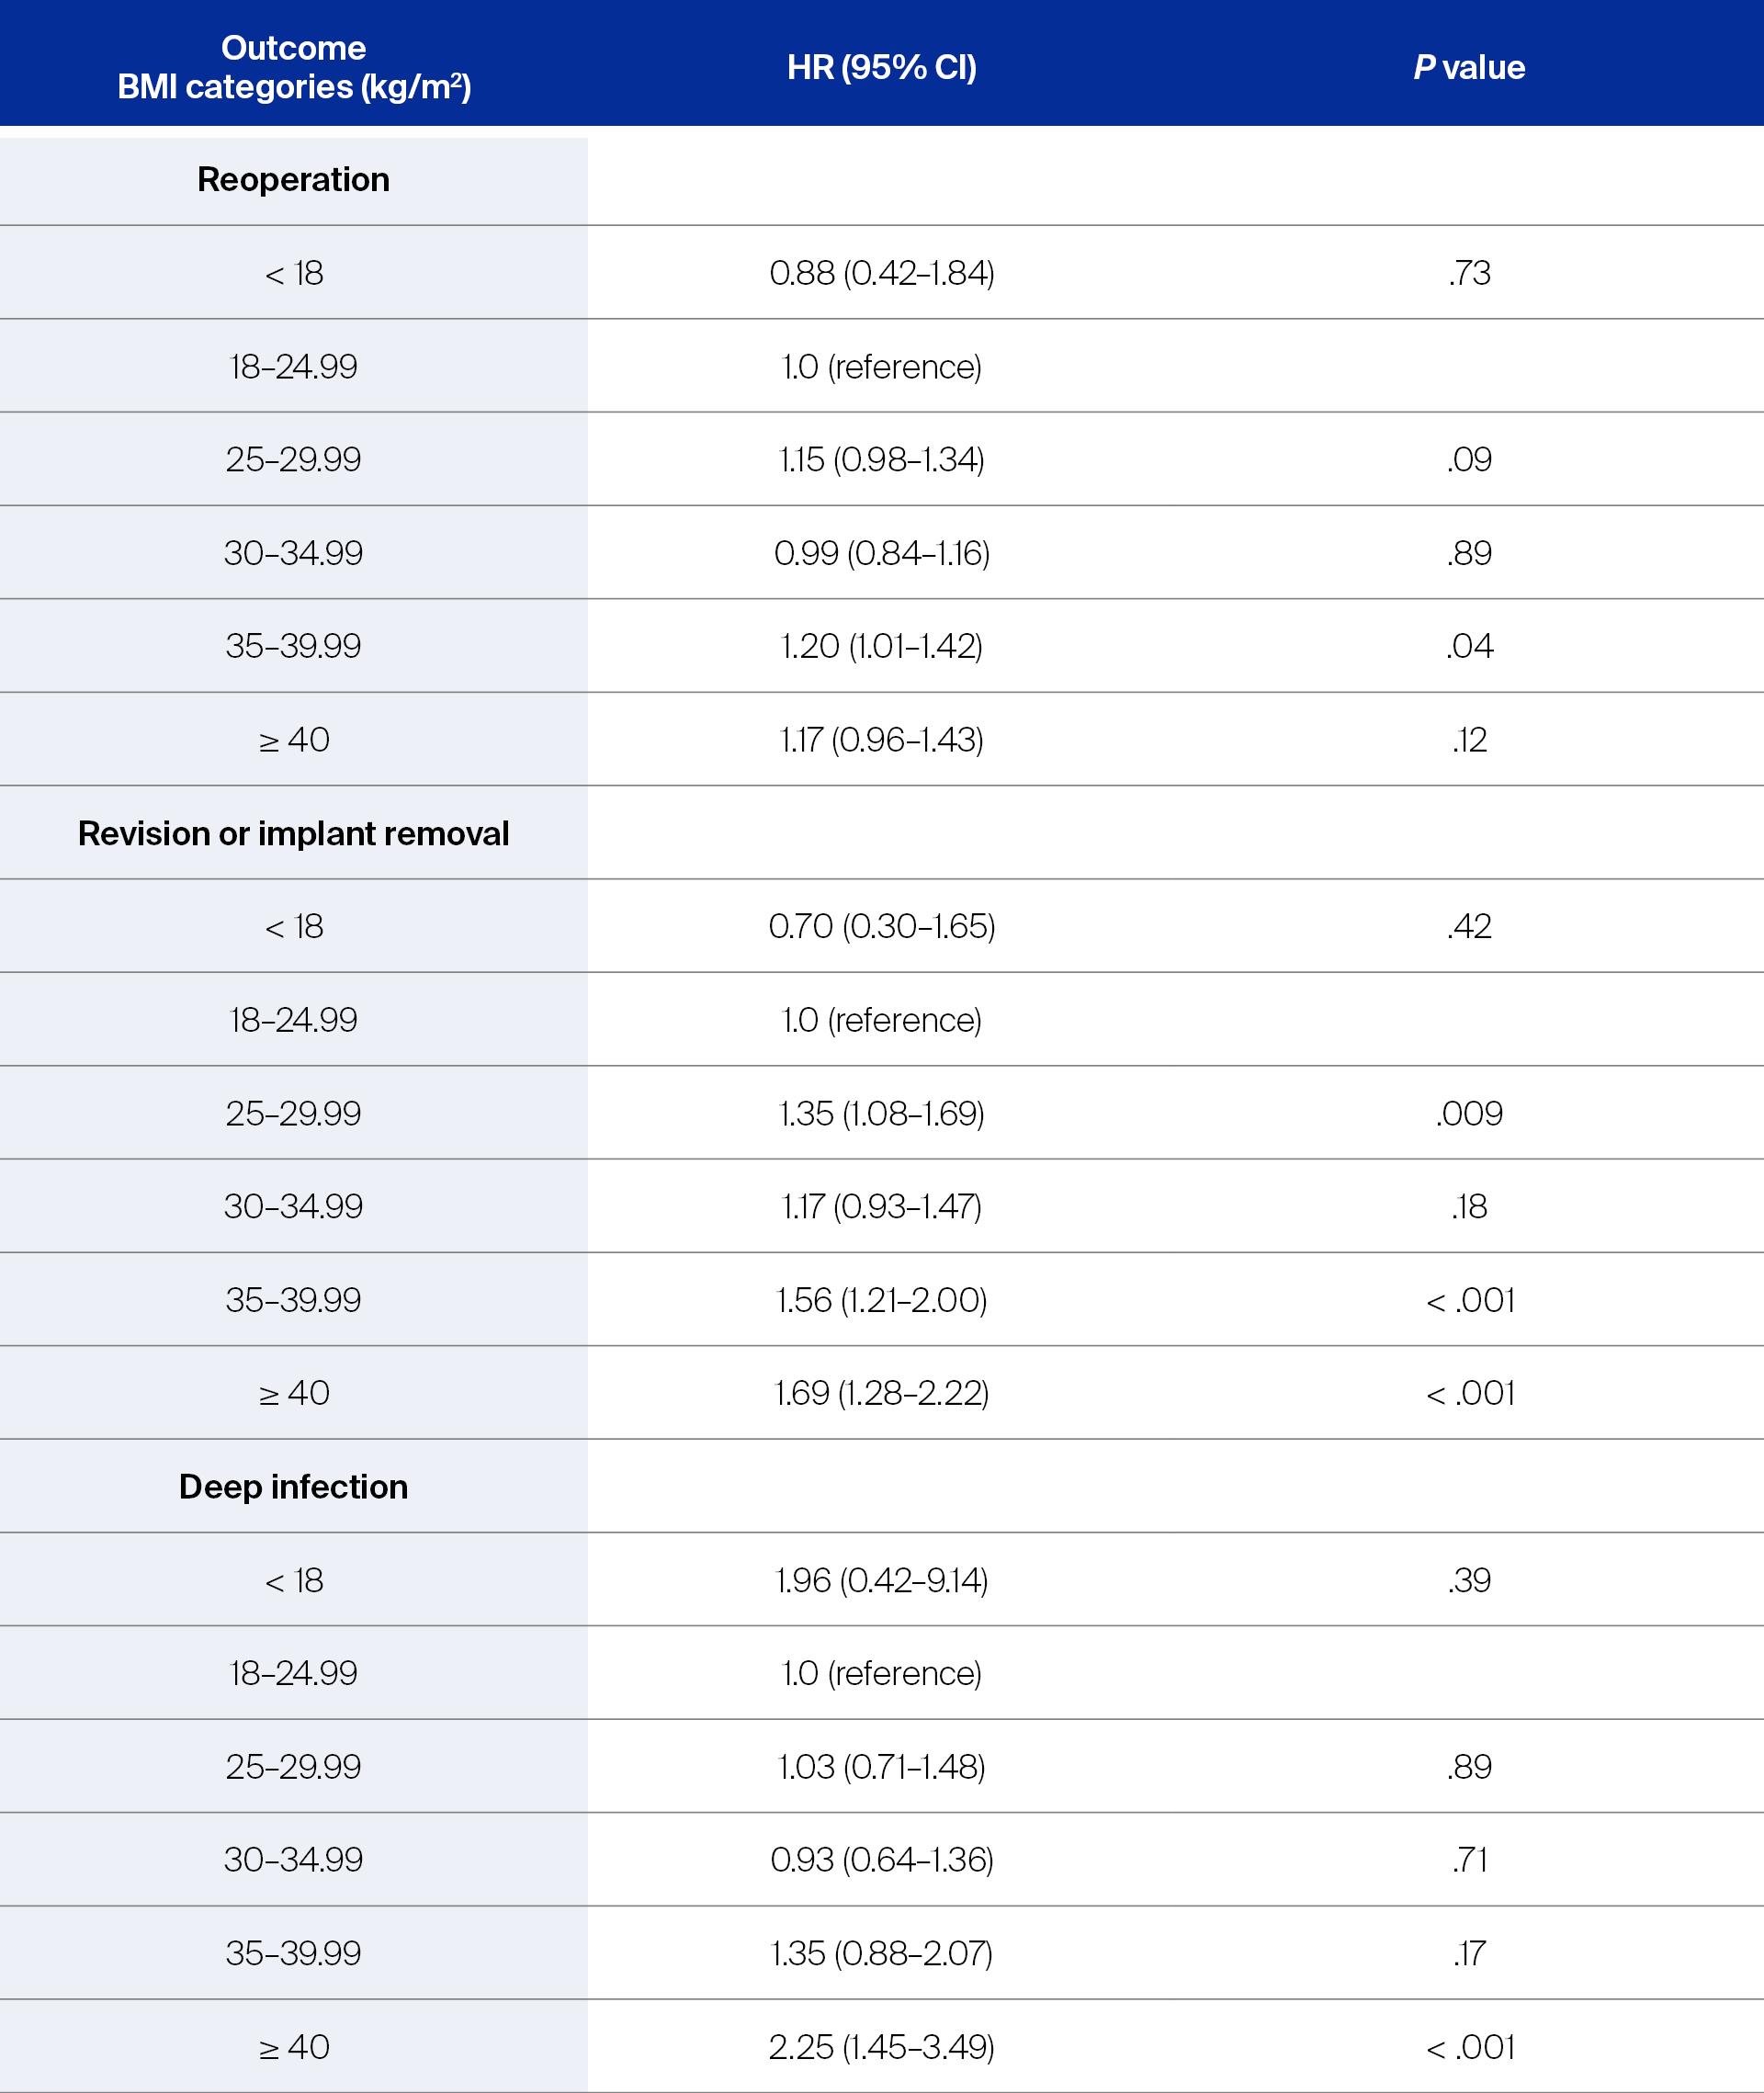
Abbreviations: BMI: body mass index, HR: hazard ratio, CI: confidence interval
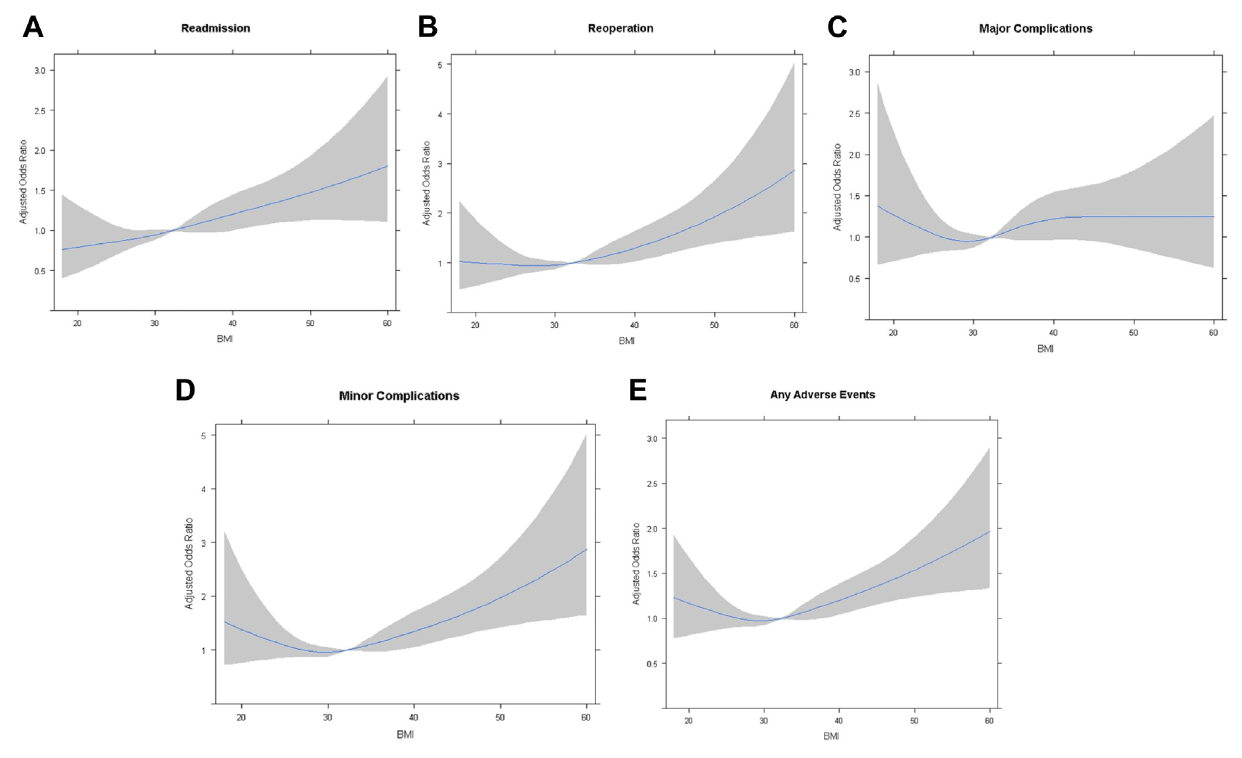
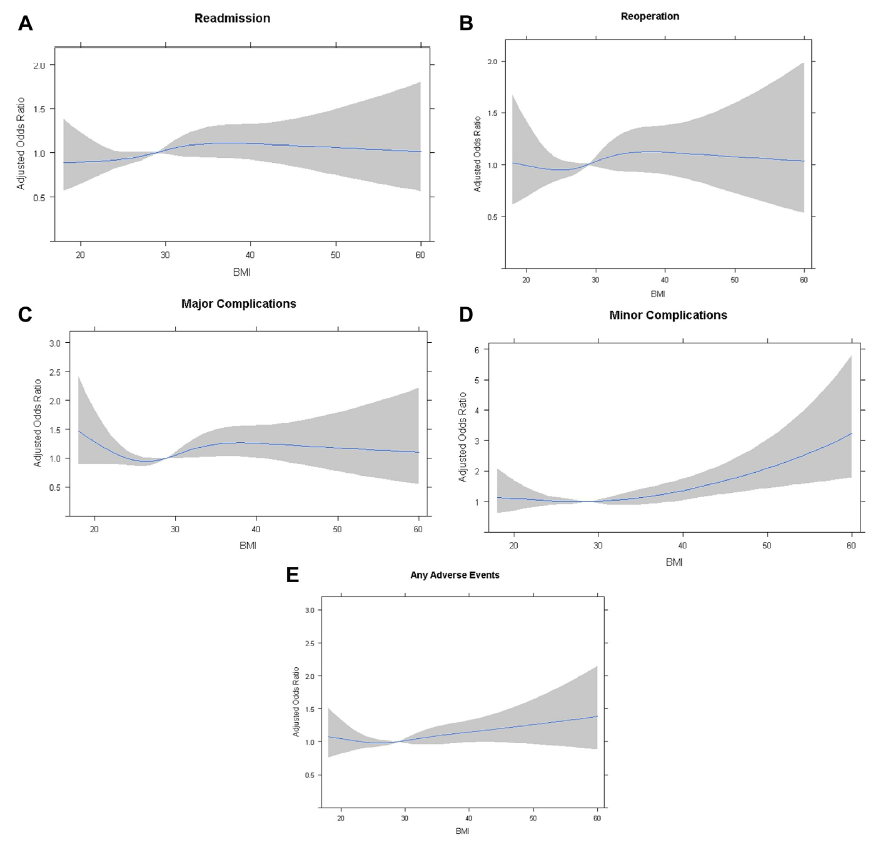
- Roth et al [16] investigated the association of BMI (both as a categorical and a continuous variable) with 30-day complications, readmissions, and reoperations after revision joint arthroplasty (rTKA and rTHA). In a population of 18,866 patients (9,093 rTHA and 9,773 rTKA) from the American College of Surgeons National Surgical Quality Improvement Project database, multivariate regression models showed that statistically significant (P < .005) increases in readmission and reoperation rates after rTKA were detected only when comparing morbidly obese patients (BMI of ≥ 40 kg/m2) to patients who had normal BMI (similar association was not detected in rTHA patients). Similar to what Wagner et al [4] had found, the relationship between BMI and complications after rTKA and rTHA was not linear (except for in the case of readmission after rTKA, see Figure 1). Roth et al [16] described the association between BMI and reoperation (and “any adverse events”) as a J-shaped curve after rTKA, with the lowest rates occurring at BMI a bit under 30 kg/m2 (Figure 1). The correlations between BMI and 30-day complications, readmissions, as well as reoperations after rTHA were weaker than those after rTKA.
Kwasny et al [9] further showed that different statistical modeling methods can result in different BMI cutoffs. When a categorical modeling (WHO classes) was used, the result indicated that BMI cutoff at 40 kg/m2 for TKA or 35 kg/m2 for THA was associated with higher risks of major complications. But when BMI was analyzed as a continuous variable with the spline method, an elevated risk of major complications started at a cutoff point of 44 kg/m2 for TKA and 35 kg/m2 for THA. Additionally, based on analyses of the area under the receiver operating characteristic (ROC) curves yielding values between 0.51 and 0.56, the authors determined that BMI was a poor prognosticator for complications with false-positive rates of 96–97%—meaning that patients will be arbitrarily labeled as “high risk” when there is little evidence to support this “prognosis”, and false-negative rates of 2–3%.
Do obese patients benefit from arthroplasties as much as patients who have normal BMI?
On the one hand, many studies have shown that obese patients had worse outcomes after TKA. On the other hand, many reports have also shown that, although obese patients may score worse in functional and quality of life scores (such Western Ontario and McMasters Universities Osteoarthritis Index [WOMAC], and EuroQol 5-D [EQ-5D]), both preoperatively and postoperatively, the improvement numerically was similar among patients of different BMI categories. Furthermore, some of these reports even found that obese patients had improved more than patients who had lower categories of BMI [7, 10, 17–19]. Therefore, the question remains, is there enough clinical evidence to demonstrate a good balance of benefit by imposing a restrictive criterion based on BMI thresholds?
Similarly, Roth et al [10] determined that, the 90-day readmission after primary TKA were similar across BMI categories. If a BMI of 40 kg/m2 (PPV = 5.36%) was used as a cutoff value to determine if a patient was eligible for a TJA, 18 patients would be denied a 90-day readmission-free surgery for one 90-day readmission avoided.
With these numbers in mind, how would you manage an obese patient?
Central versus peripheral obesity
Recognizing that BMI does not always have the ability to differentiate among bone, muscle, and fat mass nor fat distribution, and that BMI is not always a reliable indicator of surgical difficulties or complications after arthroplasty, it may be important to focus on the suitability of the joints to be operated on. Michael Mont tells us, “BMI isn't always a good measure on its own; one has to consider the characteristics of each individual patient. A BMI of 40 may be a good general threshold, but there are many types of “40-plus BMI” patients. Consider this: a patient who has a BMI of 40 can be heavy but has skinny limbs and relatively little fat around the knees and ankles. A surgery, whether THA or TKA, would not be particularly difficult in such patients.”
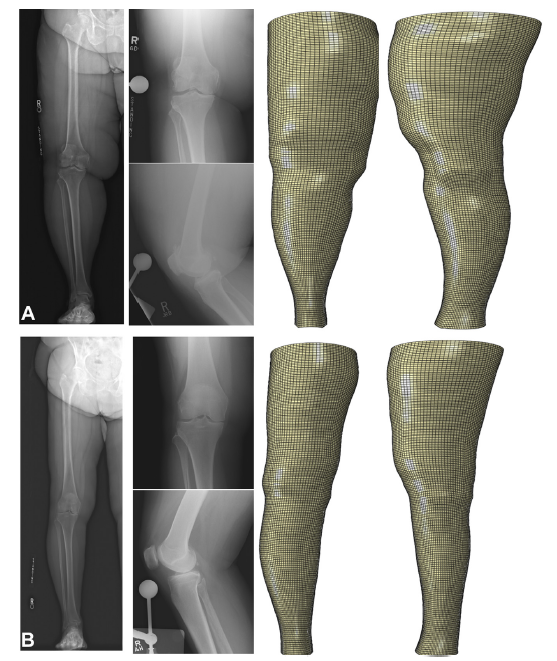
As has been observed by Elkin et al [20], among the 232 obese subjects analyzed, large variations in leg shape were observed. This point is demonstrated in Figure 3, where patient A and patient B both were morbidly obese with BMI > 40 kg/m2. Patient B showed a pattern of more central adipose distribution.
Consistent with Mont's statement, in exploring the relationship between tourniquet time (a surrogate of surgical difficulty) and anthropometric measurements versus tourniquet time and BMI, Armstrong et al [21] reported that tourniquet time was significantly associated with preoperative inferior knee circumference (P = .025) and ankle circumference (P = .003), as well as the intraoperative depth of incision at the quadriceps (P = .014). In contrast, BMI was not significantly associated with tourniquet time.
A patient-centered approach: allowing and motivating patients to invest in their own medical future
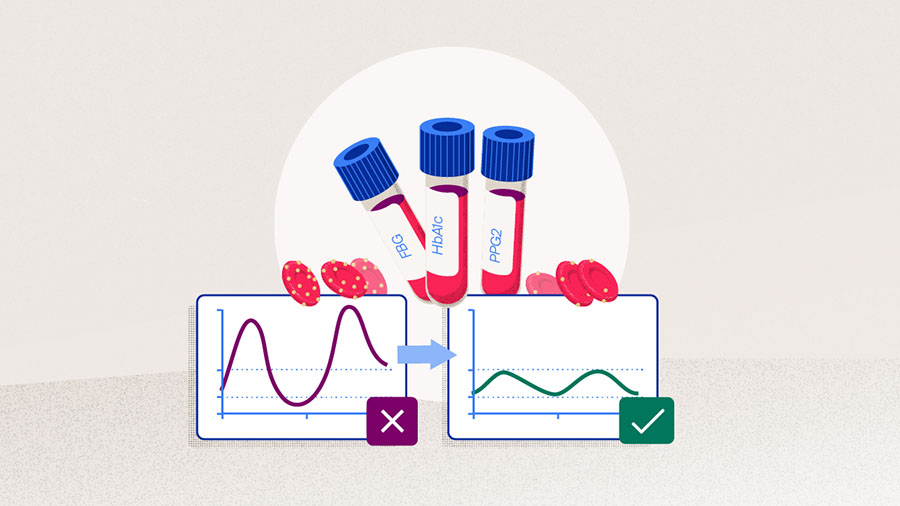
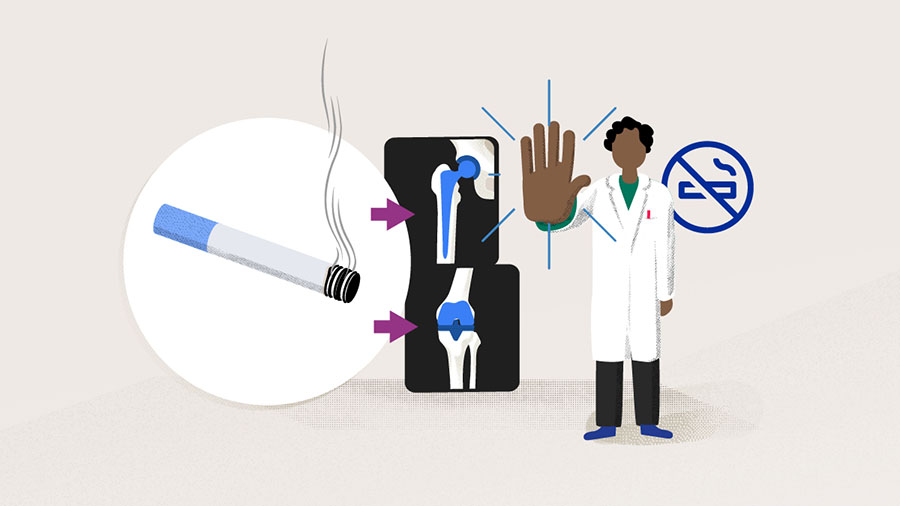
Whether using BMI cutoff values, anthropometric measurements, or the thickness of subcutaneous fat, the ultimate question for a surgeon is, how does one treat morbidly obese patients? We ask Michael Mont to share his thoughts and he tells us, “The most important thing is that patients have to be willing to invest in their own health.” This means that, “TJA is an elective surgery and can be planned. For an obese patient, I would address any modifiable risk factors for infections or other complications. I would have them see a nutritionist, get on with healthy living—move more, exercise more. The numbers from laboratory tests should be checked so that all things that can be corrected, such as blood sugar, hemoglobin A1C levels, and other values, should be corrected. The patient should abstain from or wean themselves off smoking. Lastly but not the least, oral/dental infection has to be eliminated.”
Conclusion
Obesity is likely to adversely affect outcomes after TJA, whether through predisposing patients to infections, additional burden on the musculoskeletal system, or increasing technical difficulty in surgery. A patient-centered approach and an individualized risk assessment can help obese patients regain their balance in life through both healthier living and better functioning knees and hips.
Additional AO resources
Access videos, tools, and other assets.
- Videos
- AOF books in Thieme store
- Upcoming events: AO Recon Course finder
Contributing experts
This series of articles was created with the support of the following specialists (in alphabetical order):

Matthew P Abdel
Mayo Clinic
Rochester, United States

Steven MacDonald
University of Western Ontario
London, Canada
Michael A Mont
Rubin Institute for Advanced Orthopedics
Baltimore, United States
This article was compiled by Maio Chen, Senior Project Manager Medical Writing, AO Foundation, Switzerland.
References
- AAOS. Diagnosis and Prevention of Periprosthetic Joint Infections, Evidence-Based Clinical Practice Guideline2019 July 28, 2021.
- Lübbeke A, Zingg M, Vu D, et al. Body mass and weight thresholds for increased prosthetic joint infection rates after primary total joint arthroplasty. Acta Orthop. 2016;87(2):132–138.
- Issa K, Harwin SF, Malkani AL, et al. Bariatric Orthopaedics: Total Hip Arthroplasty in Super-Obese Patients (Those with a BMI of ≥50 kg/m2). J Bone Joint Surg Am. 2016 Feb 3;98(3):180–185.
- Wagner ER, Kamath AF, Fruth K, et al. Effect of Body Mass Index on Reoperation and Complications After Total Knee Arthroplasty. J Bone Joint Surg Am. 2016 Dec 21;98(24):2052–2060.
- George J, Piuzzi NS, Jawad MM, et al. Reliability of International Classification of Diseases, Ninth Edition, Codes to Detect Morbid Obesity in Patients Undergoing Total Hip Arthroplasty. J Arthroplasty. 2018 Sep;33(9):2770–2773.
- George J, Piuzzi NS, Ng M, et al. Association Between Body Mass Index and Thirty-Day Complications After Total Knee Arthroplasty. J Arthroplasty. 2018 Mar;33(3):865–871.
- Boyce L, Prasad A, Barrett M, et al. The outcomes of total knee arthroplasty in morbidly obese patients: a systematic review of the literature. Arch Orthop Trauma Surg. 2019 Apr;139(4):553–560.
- Adhikary SD, Liu WM, Memtsoudis SG, et al. Body Mass Index More Than 45 kg/m(2) as a Cutoff Point Is Associated With Dramatically Increased Postoperative Complications in Total Knee Arthroplasty and Total Hip Arthroplasty. J Arthroplasty. 2016 Apr;31(4):749–753.
- Kwasny MJ, Edelstein AI, Manning DW. Statistical Methods Dictate the Estimated Impact of Body Mass Index on Major and Minor Complications After Total Joint Arthroplasty. Clinical orthopaedics and related research. 2018;476(12):2418–2429.
- Roth A, Anis HK, Emara AK, et al. The Potential Effects of Imposing a Body Mass Index Threshold on Patient-Reported Outcomes After Total Knee Arthroplasty. J Arthroplasty. 2021 Jul;36(7s):S198–s208.
- Giori NJ, Amanatullah DF, Gupta S, et al. Risk Reduction Compared with Access to Care: Quantifying the Trade-Off of Enforcing a Body Mass Index Eligibility Criterion for Joint Replacement. J Bone Joint Surg Am. 2018 Apr 4;100(7):539–545.
- Statz JM, Odum SM, Johnson NR, et al. Failure to Medically Optimize Before Total Hip Arthroplasty: Which Modifiable Risk Factor Is the Most Dangerous? Arthroplast Today. 2021 Aug;10:18–23.
- Haverkamp D, Klinkenbijl MN, Somford MP, et al. Obesity in total hip arthroplasty--does it really matter? A meta-analysis. Acta Orthop. 2011 Aug;82(4):417–422.
- Kerkhoffs GM, Servien E, Dunn W, et al. The influence of obesity on the complication rate and outcome of total knee arthroplasty: a meta-analysis and systematic literature review. J Bone Joint Surg Am. 2012 Oct 17;94(20):1839–1844.
- Issa K, Pivec R, Kapadia BH, et al. Does obesity affect the outcomes of primary total knee arthroplasty? J Knee Surg. 2013 Apr;26(2):89–94.
- Roth A, Khlopas A, George J, et al. The Effect of Body Mass Index on 30-day Complications After Revision Total Hip and Knee Arthroplasty. J Arthroplasty. 2019 Jul;34(7s):S242–s248.
- Giesinger K, Giesinger JM, Hamilton DF, et al. Higher body mass index is associated with larger postoperative improvement in patient-reported outcomes following total knee arthroplasty. BMC Musculoskelet Disord. 2021 Jul 24;22(1):635.
- Baker P, Petheram T, Jameson S, et al. The association between body mass index and the outcomes of total knee arthroplasty. J Bone Joint Surg Am. 2012 Aug 15;94(16):1501–1508.
- Lash H, Hooper G, Hooper N, et al. Should a Patients BMI Status be Used to Restrict Access to Total Hip and Knee Arthroplasty? Functional Outcomes of Arthroplasty Relative to BMI - Single Centre Retrospective Review. Open Orthop J. 2013;7:594–599.
- Elkins JM, Simoens KJ, Callaghan JJ. Lower Extremity Geometry in Morbid Obesity-Considerations for Total Knee Arthroplasty. J Arthroplasty. 2018 Oct;33(10):3304–3312.
- Armstrong JG, Morris TR, Sebro R, et al. Prospective Study of Central versus Peripheral Obesity in Total Knee Arthroplasty. Knee Surg Relat Res. 2018 Dec 1;30(4):319–325.